

Introduction

$DAVA (Endava plc-ADR)
🏛️ Stock Market • 🏭 Technology Services
$1.59
+34.1% (Target: $1.87)
CHANNELS LIVE


In this analysis, we will delve into the daily movements of equities within the context of earnings gaps, price action patterns, and technical indicators. Our focus is on identifying potential catalysts that could drive these stocks higher or lower in the short term.
Technical Analysis
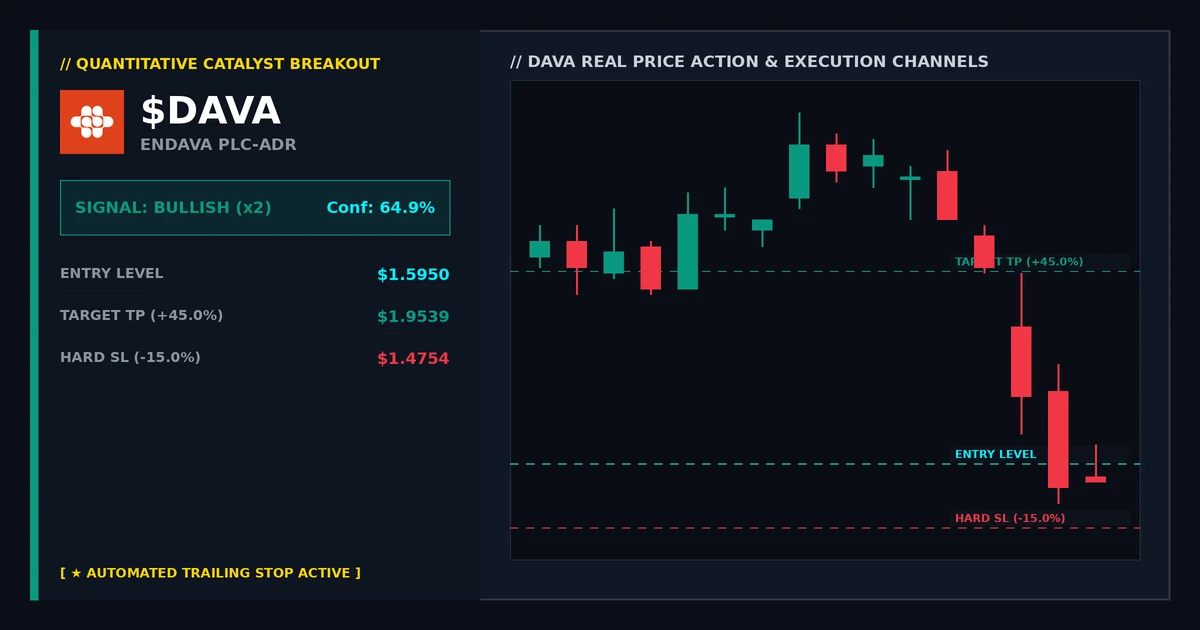
To begin our analysis, we look at the support and resistance levels for each stock. These levels are crucial as they define areas of buying interest (support) and selling pressure (resistance). For example, Endava plc-ADR ($DAVA), a technology services company, is currently trading near its 50-day moving average, which acts as both a strong level of support and resistance.
Endava plc-ADR
The stock has shown signs of consolidation between $1.60 and $1.70, with the current price at approximately $1.595. This range is marked by a series of lower highs and lower lows, indicating a potential continuation of sideways movement unless there are significant catalysts to break out.
IDEXX Laboratories
For $IDXX, the company that specializes in veterinary diagnostics, we observe a strong uptrend supported by recent earnings reports. The stock has been trading above its 50-day moving average and is near $562.73, which acts as resistance. However, if this level breaks down, it could indicate a significant shift in sentiment.
Institutional Volume Flow
Understanding the flow of institutional volume can provide insights into market dynamics and potential catalysts. For instance, Endava plc-ADR has seen increased buying interest over the past week, with notable purchases near support levels. This suggests that traders are positioning themselves for a breakout.
Endava plc-ADR
The recent accumulation of institutional funds is evident in the chart, where there have been multiple instances of buying activity around $1.60 and $1.70. This pattern could be indicative of upcoming price action, such as a breakout above resistance.
IDEXX Laboratories
In contrast, IDXX has seen relatively stable institutional volume flow over the past month. However, if we look at historical data, there were periods where buying pressure was higher around $560, suggesting potential future catalysts for a price increase.
RSI and MACD Divergence
To further validate our analysis, let’s examine the Relative Strength Index (RSI) and Moving Average Convergence Divergence (MACD). These indicators can help us identify overbought or oversold conditions as well as potential divergences.
Endava plc-ADR
The RSI for Endava plc-ADR is currently around 45, indicating a moderate level of buying interest. The MACD, however, shows divergence with the price action, where the MACD line has been above the signal line but is now crossing below it. This suggests that if the stock breaks out of its current consolidation pattern, it could be a bullish setup.
IDEXX Laboratories
For IDXX, both RSI and MACD are in overbought territory, with the RSI at 70 and the MACD line above the signal line. The divergence here suggests that if there is a pullback, it could be a good opportunity to enter before the price action resumes its upward trajectory.
Actionable Setups
Based on our analysis, we can identify potential bullish setups for both stocks:
For Endava plc-ADR (DAVA), a breakout above $1.70 could be confirmed by sustained buying interest near support levels. This setup is valid if the price action confirms a break out, and traders should consider entering at or below $1.65 with a stop loss just above $1.72.
For IDEXX Laboratories (IDXX), a pullback to the 50-day moving average could be an ideal entry point, especially if there is confirmation of divergence in RSI and MACD. Traders should consider entering at $560 with a stop loss just above $563.
$DAVA
Endava plc-ADRWant to track more upcoming earnings and overnight gap-up candidates in real-time? Access our interactive quantitative database:
Leave a Reply