

Introduction

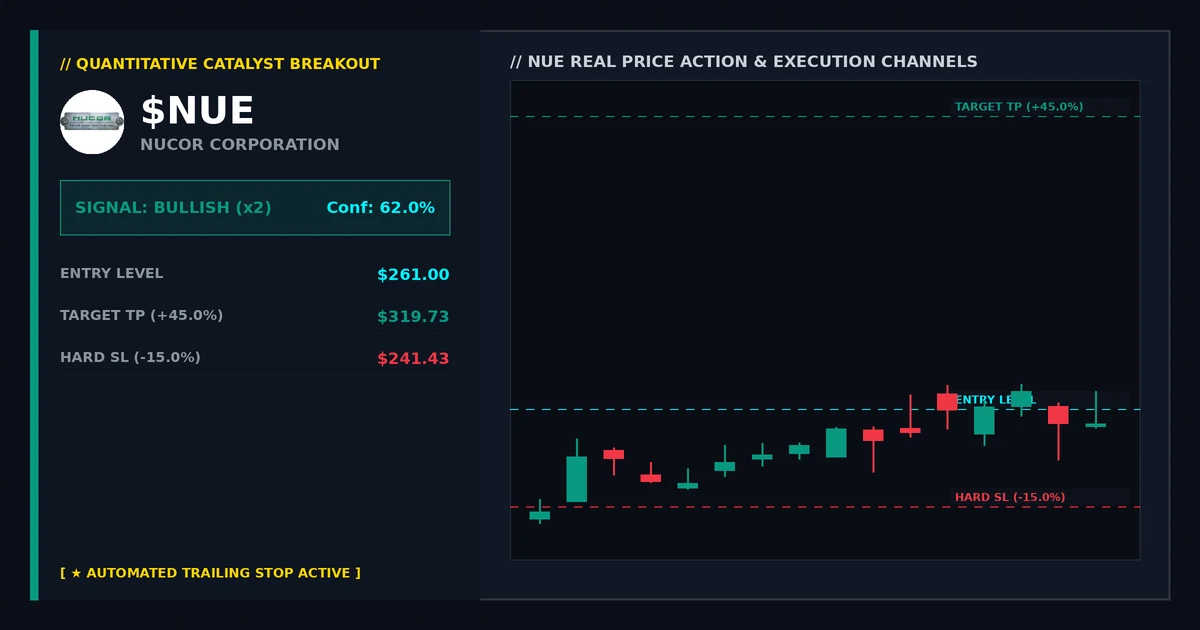
$NUE (Nucor Corporation)
🏛️ Stock Market • 🏭 Basic Materials
$261.00
+12.9% (Target: $277.83)
CHANNELS LIVE


The equity markets have been navigating through a complex landscape, influenced by various catalysts including earnings releases and broader market sentiment. This analysis focuses on two significant opportunities: Nucor Corporation (ticker: $NUE) in the Basic Materials sector and Brown & Brown Inc. (ticker: BRO) within Financial Services. Both companies are expected to release their quarterly results after close, which could potentially drive substantial price movements if they meet or exceed analyst expectations.
Technical Analysis
For Nucor Corporation (NUE), we observe a strong Support/Resistance pattern on the daily chart. The stock has been trading above its 50-day moving average, indicating a positive momentum. Furthermore, the RSI reading of around 62 suggests that the market is in a moderate bullish phase, but there’s room for further consolidation before a breakout towards higher levels.
Given NUE’s strong support and resistance lines coupled with its elevated RSI reading, an actionable setup could be identified if the stock breaks above $265.00. This would suggest a bullish continuation of the current uptrend.
Institutional Volume Flow
As for Brown & Brown Inc. ($BRO), institutional volume flow plays a critical role in determining its price action and direction. The company is expected to release earnings after close, which could impact the market’s perception of its financial health. If the release confirms strong growth or positive surprises, it might trigger significant buying interest, potentially leading to a substantial upward move.
Given BRO’s recent consolidation around $73.00 and the presence of institutional buyers pushing the price above this level, an actionable setup could be identified if the stock breaks through $74.50. This would signal a bullish continuation with potential upside targets at $76.00.
RSI and MACD Divergence
Both companies exhibit RSI readings that suggest ongoing market sentiment, but there is an interesting divergence between the Relative Strength Index (RSI) and Moving Average Convergence Divergence (MACD). For NUE, a bullish divergence suggests that buying pressure may be building up. In contrast, for BRO, a bearish MACD divergence indicates that selling pressure might be increasing despite positive RSI readings.
For BRO, if the current trend continues and we see further declines in the MACD line while the RSI remains bullish, this could indicate a potential bearish continuation. This setup would be identified by looking for a break below $72.00, followed by a sustained decline towards $69.50.
$NUE
Nucor CorporationWant to track more upcoming earnings and overnight gap-up candidates in real-time? Access our interactive quantitative database:
Leave a Reply