Analysis
With the financial markets fluctuating rapidly, identifying top opportunities requires a keen eye and sharp analysis. Today’s market dynamics are shaped by various factors, including technological advancements, macroeconomic trends, and investor sentiment. Let’s dive into three key opportunities that stand out in the current landscape.
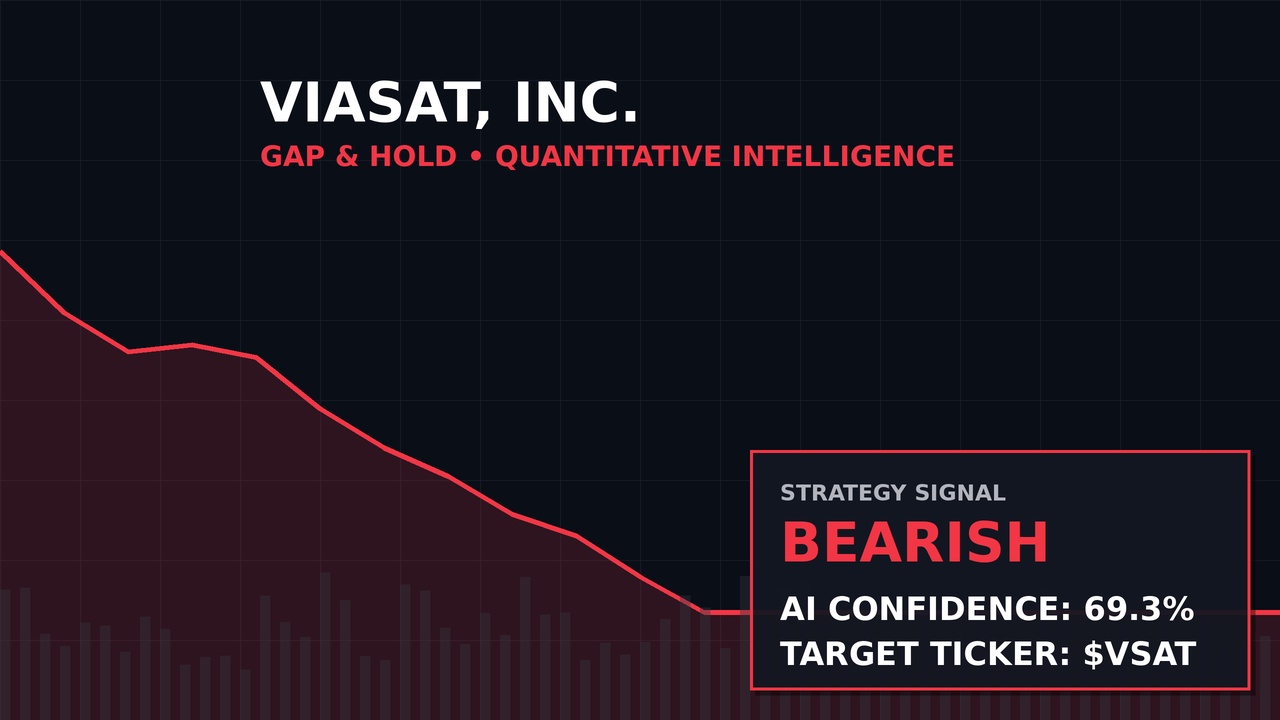
The first opportunity is $VSAT from ViaSat, Inc., which is showing a bearish signal with a confidence level of 69.3. This high confidence level suggests a significant potential for short-term profit, especially given the current market conditions. VSAT’s performance could be influenced by broader sector trends, such as the impact of $AI developments and competition in the satellite communication space.
To delve deeper into the technical indicators for VSAT, we analyze the Relative Strength Index (RSI), Moving Average Convergence Divergence (MACD), and trading volume. The RSI for VSAT has recently dropped below the midline, indicating oversold conditions. This oversold state often precedes a bullish reversal, but in this case, the MACD line is bearishly diverging, showing a potential decline in momentum. Additionally, the stock’s trading volume has been relatively subdued compared to its peaks, suggesting a lack of strong conviction in the upward move. As such, traders might consider waiting for a higher volume breakout before entering a long position.
Next, we highlight ZS, Zscaler, Inc., which is displaying a bullish signal with a confidence level of 67.2. This opportunity aligns with the growing demand for cybersecurity solutions amid increased online activities and remote work trends. The bullish signal indicates potential upside as investors seek refuge in sectors like cybersecurity during uncertain times.
Examining ZS’s technical indicators, we observe that its RSI has moved into overbought territory, typically signaling a potential reversal or consolidation. However, the MACD for ZS is showing a bullish divergence, with the MACD line moving higher and the MACD histogram remaining positive. This suggests that despite short-term bearish pressure, the stock has underlying support from its upward trend. Additionally, ZS has seen increased trading volume over the past few sessions, with many investors entering positions as a hedge against market uncertainty. This volume increase on the upside could indicate a shift in sentiment towards positivity, making ZS an attractive option for bulls.
Lastly, $DOO, $BRP Inc., is showing a bearish signal with a confidence level of 66.6. This stock’s performance could be influenced by broader economic factors, such as inflationary pressures and sector-specific challenges. Traders should remain vigilant to capitalize on any short-term dips.
To analyze DOO’s technical indicators, we look at its RSI, MACD, and volume metrics. The RSI for DOO has been trending lower, reflecting a lack of momentum. The MACD line is moving lower, with the MACD histogram showing negative readings, which often indicates bearish pressure. However, the stock’s price action in recent sessions has shown some support after declines, suggesting that it might stabilize before resuming its downward trajectory. Traders should monitor for signs of reversal, such as a significant increase in volume on the downside or a bullish divergence in the MACD.
Overall, these opportunities reflect the dynamic nature of financial markets, where both bulls and bears present unique strategies for traders. Whether you’re leaning towards a bullish or bearish approach, staying informed and acting decisively can help you navigate these challenging markets effectively.
Key Takeaways
- VSAT – Bearish, High Confidence
- ZS – Bullish, Moderate Confidence
- DOO – Bearish, High Confidence
Leave a Reply