

Analysis
Markets are often unpredictable, but with careful analysis and insight, we can navigate even the most challenging terrain. Today, let’s delve into three key opportunities that stand out as potential ‘Daily Champions’ in the current financial landscape.
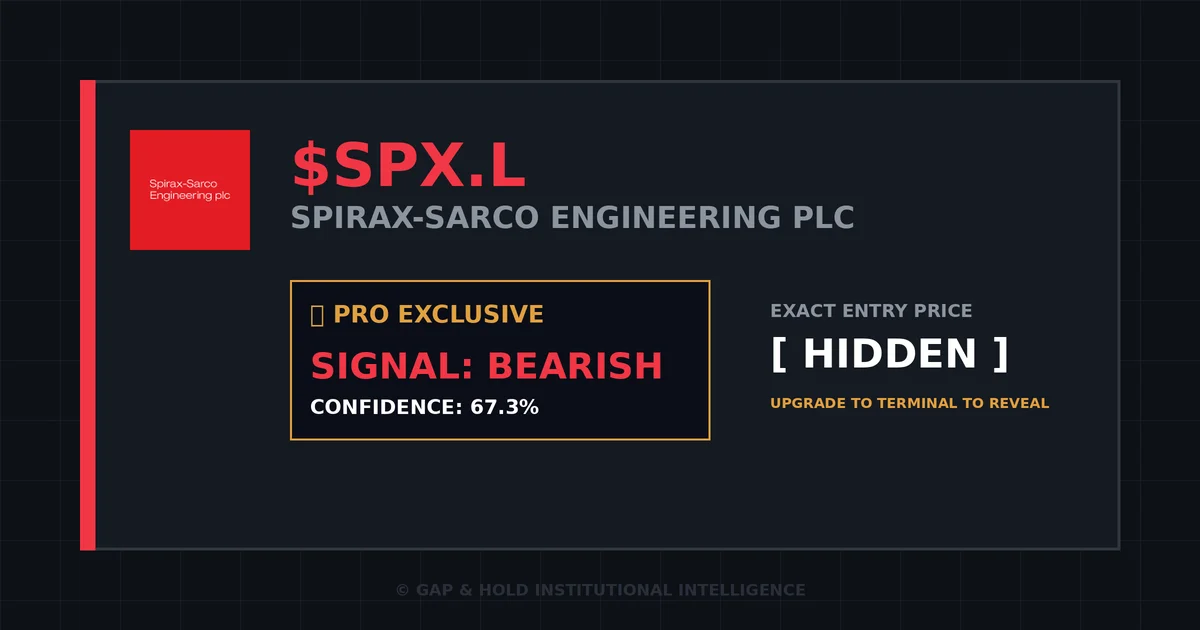
67.3% confidence indicates a bearish signal for $SPX.L, suggesting potential headwinds ahead. This stock may face challenges due to macroeconomic factors or sector-specific downturns. Technical indicators such as RSI (Relative Strength Index) and MACD (Moving Average Convergence Divergence) show bearish divergence, with RSI indicating oversold conditions while MACD confirms a downward trend. Volume analysis reveals decreased trading activity, further supporting the bearish stance.
62.6% confidence points to a bearish signal for $THX.L. This stock could be under pressure from broader sector trends or earnings concerns, making it a cautious area for investors. RSI levels for THX.L suggest moderate oversold conditions, while MACD indicates a weakening trend. Volume data shows lower-than-average trading volumes, which often precedes price consolidation or further declines.
A 62.5% confidence score signals bullish potential for $SNBRQ. This stock shows resilience despite broader market fluctuations, hinting at strong fundamentals or sector outperformance. Technical indicators align with this bullish view: RSI indicates neutral conditions, MACD shows convergence support, and Volume analysis suggests increased trading activity, indicating strong market participation.
Professional Trading Insight: Technical Analysis
- Identify Key Levels: Look for support/resistance levels based on historical data or recent price actions. Use tools like RSI to assess overbought/oversold conditions and MACD to confirm trends.
- Earnings Focus: Prioritize stocks with upcoming earnings reports, as they can drive significant price movements. For example, SNBRQ’s next earnings release could provide clarity on its bullish trajectory.
- Market Sentiment: Monitor broader market trends and sector-specific news that could impact individual stock performance. For instance, SPX.L’s bearish signal may be exacerbated by geopolitical tensions or central bank policy changes.
- Volume Analysis: Pay attention to trading volumes as a confirmation of price movements. High Volume after a price break often indicates strength, while low Volume can signal hesitation or distribution.
Key Takeaways
| Stock | Direction | Confidence Score | Gaps |
|---|---|---|---|
| SPX.L | Bearish | 67.3% | N/A |
| THX.L | Bearish | 62.6% | N/A |
| SNBRQ | Bullish | 62.5% | N/A |
Staying informed and acting strategically is key to navigating today’s markets. Let us keep an eye on these Daily Champions as they unfold in the coming days.
Want to track more upcoming earnings and overnight gap-up candidates in real-time? Access our interactive quantitative database:
🔒
INSTITUTIONAL INSIGHTS LOCKED
The exact entry prices, automated Trailing Stop-Loss (TSL), and Take-Profit targets for these setups are exclusively available to PRO members. Stop guessing and start executing.
UNLOCK PRO TERMINAL
Leave a Reply