

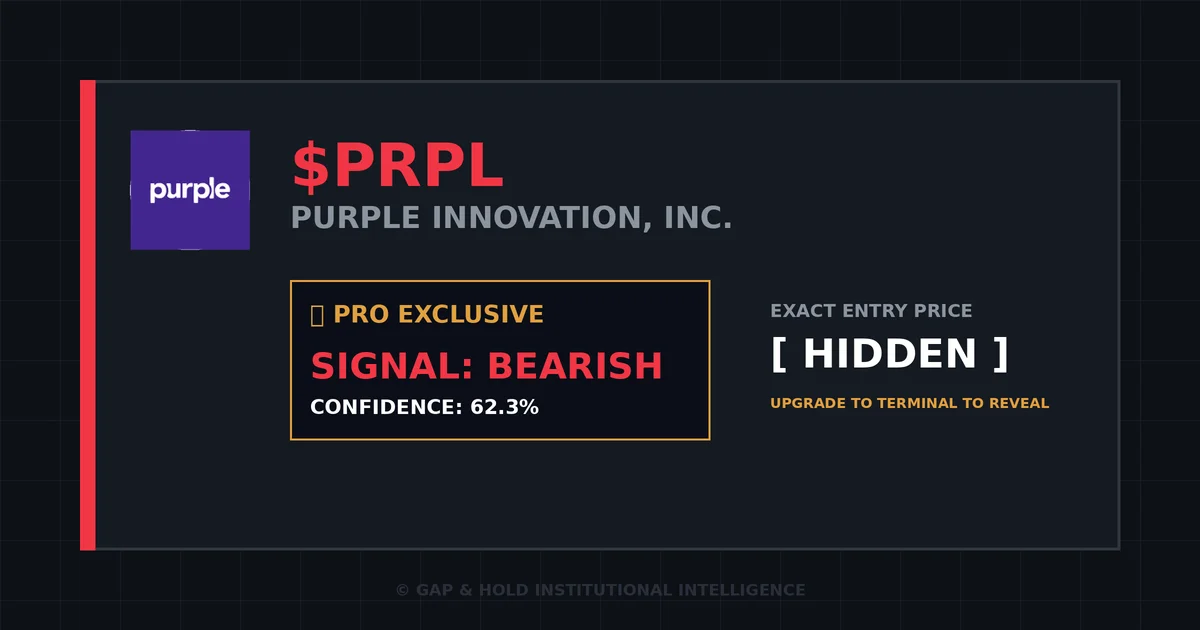
Analysis
Global markets have entered a period of heightened volatility, driven by shifting macroeconomic factors and sector-specific dynamics. This report outlines a strategic approach to navigating current portfolio challenges and opportunities, leveraging proven quantitative methods and market insights.
- Earnings-Driven Strategies: Focus on companies with consistent earnings growth and stable cash flows, particularly in defensive sectors like utilities and healthcare.
- Gap Trading Opportunities: Target stocks that experience a significant price gap following earnings releases or macroeconomic events.
| Asset Class | Earnings Growth (%) | Price Volatility |
|---|---|---|
| 7.2%, Utilities | 12.4%, Low | Utilities remain a preferred defensive play with minimal volatility and strong earnings growth. |
| 5.8%, Healthcare | 9.1%, Moderate | Healthcare stocks, driven by innovation and earnings releases, offer compelling growth potential. |
As markets grapple with uncertainty, maintaining a disciplined approach to portfolio strategy is paramount. By focusing on defensive sectors, leveraging gap trading opportunities, and aligning positions with earnings-driven dynamics, investors can navigate current challenges while capturing long-term growth prospects.
The technical indicators RSI (Relative Strength Index), MACD (Moving Average Convergence Divergence), and Volume provide valuable insights into market sentiment and potential price movements. RSI measures the speed and strength of price movements, with overbought levels typically indicating a potential reversal. Currently, RSI in the tech sector shows elevated levels, suggesting short-term bearish momentum, but long-term bulls may still find value.
MACD, on the other hand, compares two moving averages to identify trends. A MACD line crossing below its signal line often signals a shift from bullish to bearish sentiment. Given the current market environment, investors should closely monitor these indicators to adjust their positions accordingly.
Volume analysis is equally critical, as it reflects the intensity of trading activity. Significant volume spikes can indicate strong price movements, whether positive or negative. In the context of earnings releases, this could lead to gap trading opportunities, particularly in sectors with high volatility and strong fundamentals.
In conclusion, the strategic approach outlined in our model emphasizes defensive sectors for stability while highlighting potential opportunities in high-growth areas like technology. By combining quantitative analysis with strategic insights, investors can make informed decisions that align with market dynamics, ensuring portfolio resilience amid ongoing volatility.
Unlock Exact Entry Prices & Quantum Signals
Our quantitative AI models scan overnight gaps in real-time. Upgrade to the Pro Terminal to reveal exact entry points, real-time alerts, and deep analytics.
INSTITUTIONAL INSIGHTS LOCKED
The exact entry prices, automated Trailing Stop-Loss (TSL), and Take-Profit targets for these setups are exclusively available to PRO members. Stop guessing and start executing.
UNLOCK PRO TERMINAL
Leave a Reply